Evaluating the Transfer of Information in Phase Retrieval STEM Techniques
Contents
Analytical STEM CTF ingredients
%matplotlib widget
import numpy as np
import matplotlib.pyplot as plt
from matplotlib.gridspec import GridSpec
import ctf # import custom plotting / utils
import cmasher as cmr
import tqdm
import ipywidgets
# parameters
n = 512
q_max = 2 # inverse Angstroms
q_probe = 1 # inverse Angstroms
wavelength = 0.019687 # 300kV
sampling = 1 / q_max / 2 # Angstroms
reciprocal_sampling = 2 * q_max / n # inverse Angstroms
scan_step_size = 1 # pixels
sx = sy = n//scan_step_size
phi0 = 1.0
color = 'darkslategray'def white_noise_object_2D(n, phi0):
""" creates a 2D real-valued array, whose FFT has random phase and constant amplitude """
evenQ = n%2 == 0
# indices
pos_ind = np.arange(1,(n if evenQ else n+1)//2)
neg_ind = np.flip(np.arange(n//2+1,n))
# random phase
arr = np.random.randn(n,n)
# top-left // bottom-right
arr[pos_ind[:,None],pos_ind[None,:]] = -arr[neg_ind[:,None],neg_ind[None,:]]
# bottom-left // top-right
arr[pos_ind[:,None],neg_ind[None,:]] = -arr[neg_ind[:,None],pos_ind[None,:]]
# kx=0
arr[0,pos_ind] = -arr[0,neg_ind]
# ky=0
arr[pos_ind,0] = -arr[neg_ind,0]
# zero-out components which don't have k-> -k mapping
if evenQ:
arr[n//2,:] = 0 # zero highest spatial freq
arr[:,n//2] = 0 # zero highest spatial freq
arr[0,0] = 0 # DC component
# fourier-array
arr = np.exp(2j*np.pi*arr)*phi0
# inverse FFT and remove floating point errors
arr = np.fft.ifft2(arr).real
return arr
# potential
potential = white_noise_object_2D(n,phi0)
complex_obj = np.exp(1j*potential)# we build probe in Fourier space, using a soft aperture
qx = qy = np.fft.fftfreq(n,sampling)
q2 = qx[:,None]**2 + qy[None,:]**2
q = np.sqrt(q2)
theta = np.arctan2(qy[None,:],qx[:,None])
x = y = np.arange(0.,n,scan_step_size)
xx, yy = np.meshgrid(x,y,indexing='ij')
positions = np.stack((xx.ravel(),yy.ravel()),axis=-1)
row, col = ctf.return_patch_indices(positions,(n,n),(n,n))
probe_array_fourier_0 = np.sqrt(
np.clip(
(q_probe - q)/reciprocal_sampling + 0.5,
0,
1,
),
)def autocorrelation(array):
""" """
return np.real(
np.fft.ifft2(
np.abs(
np.fft.fft2(
array
)
)**2
)
)
probe_array_fourier_0_normalized = probe_array_fourier_0 / np.sqrt(np.sum(probe_array_fourier_0**2))
aperture_autocorrelation = autocorrelation(probe_array_fourier_0_normalized)centered_aperture = np.fft.fftshift(probe_array_fourier_0)
padded_aperture = np.pad(centered_aperture,n//4)
def roll_padded_array(shift_px):
""" """
return np.roll(
padded_aperture,
shift_px,
(0,1)
)[n//4:-n//4,n//4:-n//4]
def double_overlap_difference(shift_px):
""" """
array_1 = centered_aperture
array_2 = roll_padded_array(shift_px)
return array_2 - array_1
def double_overlap_union(shift_px):
""" """
array_1 = centered_aperture
array_2 = roll_padded_array(shift_px)
return (array_2 + array_1).clip(0,1)
def double_overlap(shift_px,ax):
""" """
im = ax.imshow(
double_overlap_difference(shift_px),
alpha = double_overlap_union(shift_px),
cmap='PiYG',
vmin=-1.5,
vmax=1.5,
)
return imdef radially_average_ctf(
corner_centered_ctf,
sampling=(sampling,sampling)
):
""" returns the radially-averaged CTF of a corner-centered 2D CTF array. """
nx, ny = corner_centered_ctf.shape
sx, sy = sampling
kx = np.fft.fftfreq(nx,sx)
ky = np.fft.fftfreq(ny,sy)
k = np.sqrt(kx[:,None]**2 + ky[None,:]**2).ravel()
intensity = corner_centered_ctf.ravel()
bin_size = kx[1]-kx[0]
k_bins = np.arange(0, k.max() + bin_size, bin_size)
inds = k / bin_size
inds_f = np.floor(inds).astype("int")
d_ind = inds - inds_f
nf = np.bincount(inds_f, weights=(1 - d_ind), minlength=k_bins.shape[0])
nc = np.bincount(inds_f + 1, weights=(d_ind), minlength=k_bins.shape[0])
n = nf + nc
I_bins0 = np.bincount(
inds_f, weights=intensity * (1 - d_ind), minlength=k_bins.shape[0]
)
I_bins1 = np.bincount(
inds_f + 1, weights=intensity * (d_ind), minlength=k_bins.shape[0]
)
I_bins = (I_bins0 + I_bins1) / n
# inds = k_bins <= np.abs(kx).max()
return k_bins, I_bins
q_bins, I_bins = radially_average_ctf(aperture_autocorrelation)# visualization
with plt.ioff():
dpi=72
fig, (ax_0,ax_1,ax_2) = plt.subplots(1,3,figsize=(640/dpi,260/dpi),dpi=dpi)
fontsize = 12
ax_0.imshow(
np.fft.fftshift(
aperture_autocorrelation
),
cmap = cmr.eclipse
)
ax_0.set(xticks=[],yticks=[])
ax_0.set_title("aperture autocorrelation",fontsize=fontsize)
scatter = ax_0.scatter(n//2,n//2,color='red')
ctf.visualize.add_scalebar(
ax_0,
n//4,
reciprocal_sampling,
r"$q_{\mathrm{probe}}$",
size_vertical=2.5,
)
im = double_overlap((0,0),ax_1)
ax_1.set_title("double overlap region",fontsize=fontsize)
ax_1.set(
facecolor='black',
xticks=[],
yticks=[]
)
ctf.visualize.add_scalebar(
ax_1,
n//4,
reciprocal_sampling,
r"$q_{\mathrm{probe}}$",
size_vertical=2.5,
)
ax_2.plot(q_bins,I_bins,color=color)
ax_2.set_title("radially-averaged autocorrelation",fontsize=fontsize)
ax_2.set(
xlim=[0,2*np.sqrt(2)],
ylim=[-0.025,1.025]
)
ax_2.set(
yticks=[],
xticks=[0,1,2],
xlabel=r"spatial frequency, $q/q_{\mathrm{probe}}$",
aspect=2*np.sqrt(2) / 1.05
)
vline = ax_2.vlines(1,-0.025,1.025,color='black',linestyle='--')
fig.tight_layout()
fig.canvas.resizable = False
fig.canvas.header_visible = False
fig.canvas.footer_visible = False
fig.canvas.toolbar_visible = False
fig.canvas.layout.height = "270px"
# fig.canvas.toolbar_visible = True
# fig.canvas.toolbar_position = 'bottom'
# fig.canvas.layout.height = "305px"
fig.canvas.layout.width = '640px'
Nonedef update_plot(shift_px):
""" """
scatter.set_offsets([np.flip(shift_px)])
q = np.linalg.norm((shift_px-n//2)*reciprocal_sampling)
vline.set_segments([np.array([[q,-0.025],[q,1.025]])])
im.set_data(double_overlap_difference(shift_px-n//2))
im.set_alpha(double_overlap_union(shift_px-n//2))
fig.canvas.draw_idle()
return None
def onmove(event):
""" """
pos = np.array([event.ydata,event.xdata])
if event.inaxes == ax_0 and pos[0] is not None:
integer_pos = pos.astype("int")
update_plot(integer_pos)
cid = fig.canvas.mpl_connect('motion_notify_event',onmove)
fig.canvas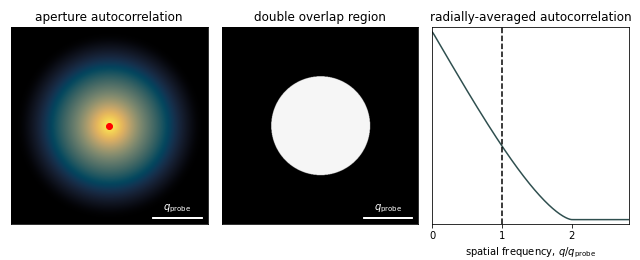
def return_chi(
    q,
    theta,
    wavelength,
    C10,
    C12,
    phi12,
    C21,
    phi21,
    C30,
):
    """ """
    prefactor = 2*np.pi / wavelength
    alpha = q*wavelength
    order_2 = alpha**2 / 2 * (C10 + C12*np.cos(2*(theta-phi12)))
    order_3 = alpha**3 / 3 * C21*np.cos(theta-phi21)
    order_4 = alpha**4 / 4 * C30

    return (order_2+order_3+order_4) * prefactor
with plt.ioff():
dpi=72
fig_chi, axs_chi = plt.subplots(1,2,figsize=(640/dpi,360/dpi),dpi=dpi)
chi = return_chi(
q,
theta,
wavelength,
100,
0,
0,
0,
0,
0
)
sin_chi = np.sin(chi)
chi_q_bins, chi_I_bins = ctf.radially_average_ctf(
sin_chi,
(sampling,sampling)
)
im_chi_2D = axs_chi[0].imshow(
ctf.complex_to_rgb(
np.fft.fftshift(
np.exp(-1j*chi)
),
vmin=0,
vmax=1
)
)
axs_chi[0].set(
xticks=[],
yticks=[],
title="aberration surface"
)
ctf.visualize.add_scalebar(
axs_chi[0],
n//4,
reciprocal_sampling,
r"$q_{\mathrm{probe}}$",
color='black',
size_vertical=2.5,
)
axs_chi[1].axhline(0,color='black',lw=1,linestyle='--')
plot_chi_1D = axs_chi[1].plot(
chi_q_bins,
chi_I_bins,
color=color
)[0]
axs_chi[1].set(
xticks=[0,1,2],
yticks=[],
xlabel=r"spatial frequency, $q/q_{\mathrm{probe}}$",
xlim=[0,2],
ylim=[-1.025,1.025],
aspect=1/1.025,
title="radially-averaged aberration surface"
)
fig_chi.tight_layout()
fig_chi.canvas.resizable = False
fig_chi.canvas.header_visible = False
fig_chi.canvas.footer_visible = False
fig_chi.canvas.toolbar_visible = False
fig_chi.canvas.layout.height = "370px"
# fig.canvas.toolbar_visible = True
# fig.canvas.toolbar_position = 'bottom'
# fig.canvas.layout.height = "305px"
fig_chi.canvas.layout.width = '640px'
Nonestyle = {'description_width': 'initial'}
layout_half = ipywidgets.Layout(width="320px",height="30px")
kwargs = {'style':style,'layout':layout_half}
C10_slider = ipywidgets.FloatSlider(
value = 100,
min = -500,
max = 500,
step = 1,
description = r"negative defocus, $C_{1,0}$ [Å]",
**kwargs
)
C12_slider = ipywidgets.FloatSlider(
value = 0,
min = 0,
max = 100,
step = 1,
description = r"astigmatism, $C_{1,2}$ [Å]",
**kwargs
)
phi12_slider = ipywidgets.FloatSlider(
value = 0,
min = 0,
max = 90,
step = 1,
description = r"astigmatism angle, $\phi_{1,2}$ [°]",
**kwargs
)
C21_slider = ipywidgets.FloatSlider(
value = 0,
min = 0,
max = 500,
step = 1,
description = r"coma, $C_{2,1}$ [nm]",
**kwargs
)
phi21_slider = ipywidgets.FloatSlider(
value = 0,
min = 0,
max = 90,
step = 1,
description = r"coma angle, $\phi_{2,1}$ [°]",
**kwargs
)
C30_slider = ipywidgets.FloatSlider(
value = 0,
min = -100,
max = 100,
step = 0.1,
description = r"spherical aberration, $C_{3,0}$ [µm]",
**kwargs
)
reset_button = ipywidgets.Button(
description="reset aberrations",
**kwargs
)
scherzer_button = ipywidgets.Button(
description="use Scherzer defocus",
**kwargs
)def update_chi(*args):
""" """
C10 = C10_slider.value
C12 = C12_slider.value
phi12 = np.deg2rad(phi12_slider.value)
C21 = C21_slider.value * 10
phi21 = np.deg2rad(phi21_slider.value)
C30 = C30_slider.value * 1e4
chi = return_chi(
q,
theta,
wavelength,
C10,
C12,
phi12,
C21,
phi21,
C30
)
sin_chi = np.sin(chi)
chi_q_bins, chi_I_bins = ctf.radially_average_ctf(
sin_chi,
(sampling,sampling)
)
im_chi_2D.set_data(
ctf.complex_to_rgb(
np.fft.fftshift(
np.exp(-1j*chi)
),
vmin=0,
vmax=1
)
)
plot_chi_1D.set_ydata(chi_I_bins)
if C12 > 0 or C21 > 0:
plot_chi_1D.set_alpha(0.5)
axs_chi[1].set_alpha(0.5)
axs_chi[1].set_title("radially-averaged* aberration surface",color='gray')
plot_chi_1D.set_linestyle("--")
else:
plot_chi_1D.set_alpha(1)
axs_chi[1].set_alpha(1)
axs_chi[1].set_title("radially-averaged aberration surface",color='black')
plot_chi_1D.set_linestyle("-")
fig_chi.canvas.draw_idle()
return None
for slider in [C10_slider,C12_slider,phi12_slider,C21_slider,phi21_slider,C30_slider]:
slider.observe(update_chi,"value")
def reset_aberrations(*args):
""" """
C10_slider.value = 100
C30_slider.value = 0
C12_slider.value = 0
phi12_slider.value = 0
C21_slider.value = 0
phi21_slider.value = 0
# update_chi(*args)
return None
def apply_scherzer(*args):
""" """
Cs = C30_slider.value*1e4
C10_slider.value = -np.sign(Cs) * np.sqrt(3/2*np.abs(Cs)*wavelength)
# update_chi(*args)
return None
reset_button.on_click(reset_aberrations)
scherzer_button.on_click(apply_scherzer)ipywidgets.VBox(
[
ipywidgets.HBox([C10_slider,C30_slider]),
ipywidgets.HBox([C12_slider,phi12_slider]),
ipywidgets.HBox([C21_slider,phi21_slider]),
ipywidgets.HBox([reset_button,scherzer_button]),
fig_chi.canvas
]
)VBox(children=(HBox(children=(FloatSlider(value=100.0, description='negative defocus, $C_{1,0}$ [Å]', layout=L…
